Aggression On Bars DEMO
- Brand: Metatrader 5
Free!
In stock
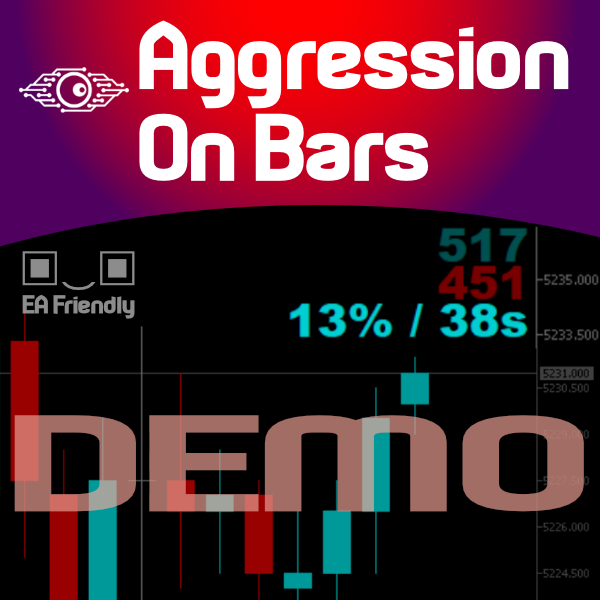
Imagine a Buy and Sell Pressure monitor on your chart that shows in REAL-TIME this data, bar by bar? Well, imagine no more. We present you an exclusive creation of Minions Labs: Aggression On Bars indicator.
Imagine um monitor de pressão de compra e venda no seu gráfico que mostra em TEMPO REAL esses dados, barra por barra? Bem, não imagine mais. Apresentamos a você uma criação exclusiva da Minions Labs:
indicador Aggression On Bars.
![]() Imagine a Buy and Sell Pressure monitor on your chart that shows in REAL-TIME this data, bar by bar?
Imagine a Buy and Sell Pressure monitor on your chart that shows in REAL-TIME this data, bar by bar?
Well, imagine no more. We present you an exclusive creation of Minions Labs: Aggression On Bars indicator. On every new bar on your chart this indicator will start counting in real-time the BUY/SELL pressure and present this data statistics directly inside your chart. As soon as a new bar is created in your chart, the counter restarts. Simple and effective. Just watch the video to see it running live.
The only recommendation is that the Symbol being analyzed – and this is because of the nature of the market not the indicator itself – it should be Liquid, otherwise, you will obviously be having wrong readings and whipsaws every time.
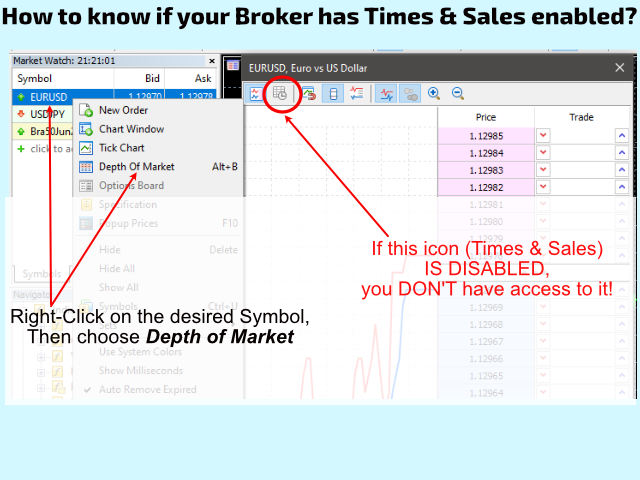
NOTE: If your Broker doesn’t provide Times & Sales data this indicator WILL NOT work. Check the screenshots below to how to identify if your Broker has Times & Sales (Times & Trades) enabled.
TRADING IDEAS
- Safe entering on candlestick patterns.
- Safe entering on Mean Reversions.
- Safe entering on Counter-trend trading.
- As a Confirmation Indicator
SETTINGS
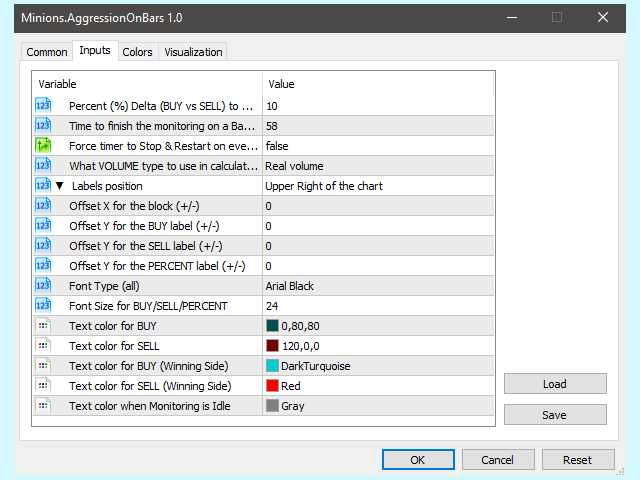
- Delta percent (BUY versus SELL) to start the monitoring. The values are up to the trader according to his/her strategies, asset being traded, timeframe, time of the day, etc. There is NO right value. The threshold being hit, the timer starts counting how many seconds elapsed within the threshold chosen.
- Time elapsed to stop the monitoring (when to stop counting the BUY/SELL data). (THIS FEATURE IS NOT AVAILABLE IN THIS DEMO VERSION)
- Do you want to force the counting to stop/restart on every new Bar?
- Volume Type to use in monitoring: Real Volume or Ticks.
- Text Styles for the real-time monitor: Color for Buy/Sell/Idle/Winning sides.
- Labels Positioning: X/Y offsets on chart, Font type, and Font size.
This DEMO version is limited to 30 seconds of monitoring, but it is enough for you to test this indicator. And hey, if 30 seconds is time enough for your trading strategy, you are in luck, you just got an indicator for free… 😉
If you would like to test as a limited Backtest the full version of Aggression On Bars, please go here:
EA FRIENDLY
- #0 = BUY Volume data
- #1 = SELL Volume data
- #2 = Delta between BUY and SELL (in %)
- #3 = Is the Delta within the user-defined threshold (1=YES / 0=NO)
- #4 = Time elapsed within the threshold (in seconds)
- #5 = Signals a BUY, when Delta reaches the threshold in buffer #3 – this buffer will contain the ASK price, otherwise, ZERO.
- #6 = Signals a SELL, when Delta reaches the threshold in buffer #3 – this buffer will contain the BID price, otherwise, ZERO.
All buffers are set with ArraySetAsSeries() as TRUE, so the “zero” elements of the buffers are the data from the current/most recent bar.
 Imagine um monitor de pressão de compra e venda no seu gráfico que mostra em TEMPO REAL esses dados, barra por barra?
Bem, não imagine mais. Apresentamos a você uma criação exclusiva da Minions Labs: o indicador Aggression On Bars. Em cada nova barra do seu gráfico, este indicador começará a contar em tempo real a pressão de COMPRA/VENDA e apresentará essas estatísticas diretamente dentro do seu gráfico. Assim que uma nova barra é criada no seu gráfico, o contador reinicia. Simples e eficaz. Apenas assista ao vídeo para vê-lo funcionando ao vivo.
A única recomendação é que o Símbolo sendo analisado – e isso é devido à natureza do mercado, não ao indicador em si – deve ser Líquido, caso contrário, você obviamente terá leituras erradas e whipsaws toda vez.
NOTA: Se sua Corretora não fornecer dados de Times & Sales, este indicador NÃO funcionará. Confira as capturas de tela abaixo para saber como identificar se sua Corretora possui Times & Sales (Times & Trades) habilitado.
IDEIAS DE NEGOCIAÇÃO
- Entrada segura em padrões de candlestick.
- Entrada segura em Reversões de Média.
- Entrada segura em negociações de contra-tendência.
- Como Indicador de Confirmação.
CONFIGURAÇÕES
Percentual de delta (COMPRA versus VENDA) para iniciar o monitoramento. Os valores são determinados pelo trader de acordo com suas estratégias, ativo negociado, período de tempo, horário do dia, etc. Não há um valor correto. Quando o limite é atingido, o cronômetro começa a contar quantos segundos se passaram dentro do limite escolhido.
Tempo decorrido para parar o monitoramento (quando parar de contar os dados de COMPRA/VENDA).
(ESTA CARACTERÍSTICA NÃO ESTÁ DISPONÍVEL NESTA VERSÃO DEMONSTRAÇÃO)
Você quer forçar a parada/reinício da contagem em cada nova Barra?
Tipo de Volume a ser usado no monitoramento: Volume Real ou Ticks.
Estilos de texto para o monitor em tempo real: Cor para os lados de Compra/Venda/Inativo/Vencedor.
Posicionamento das etiquetas: Deslocamentos X/Y no gráfico, tipo de fonte e tamanho da fonte.
Esta versão DEMO é limitada a 30 segundos de monitoramento, mas é o suficiente para você testar este indicador. E ei, se 30 segundos são tempo suficiente para sua estratégia de negociação, você está com sorte, acabou de conseguir um indicador de graça… 😉
Se você gostaria de testar como um Backtest limitado a versão completa do Aggression On Bars, por favor vá aqui:
https://www.mql5.com/en/market/product/49700
COMPATÍVEL COM EAs
Basta chamar este indicador com iCustom() seguindo a lista de parâmetros encontrada na última captura de tela abaixo. Para ler os valores do indicador, use os seguintes Buffers:
#0 = Dados de Volume de COMPRA
#1 = Dados de Volume de VENDA
#2 = Delta entre COMPRA e VENDA (em %)
#3 = O Delta está dentro do limite definido pelo usuário (1=SIM / 0=NÃO)
#4 = Tempo decorrido dentro do limite (em segundos)
#5 = Sinaliza uma COMPRA, quando o Delta atinge o limite no buffer #3 – este buffer conterá o preço ASK, caso contrário, ZERO.
#6 = Sinaliza uma VENDA, quando o Delta atinge o limite no buffer #3 – este buffer conterá o preço BID, caso contrário, ZERO.
Todos os buffers são configurados com ArraySetAsSeries() como TRUE, então os elementos “zero” dos buffers são os dados da barra atual/mais recente.
Additional information
| Computer Type | 64-bits |
|---|---|
| Platform | Metatrader 5 |
Only logged in customers who have purchased this product may leave a review.
General Inquiries
There are no inquiries yet.






Reviews
There are no reviews yet.