-
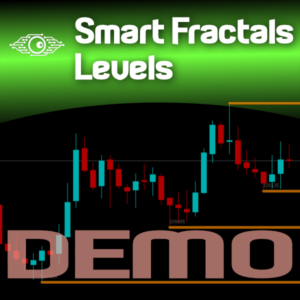
Smart Fractals Levels DEMO
Support & Resistance taken to the next level. The Smart Fractals Levels indicator is based on Bill Williams’ theory of identifying Support & Resistance levels through the use of the so-called “fractals”.
Free! -
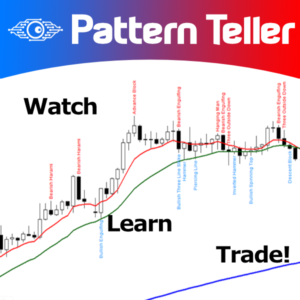
Pattern Teller DEMO
It shows on your chart the names of the famous Candlesticks Patterns formations as soon as they are created and confirmed. No repainting.
Free!Pattern Teller DEMO
Free! -
Heikin Ashi Volume DEMO
For those who love to trade using the Heikin Ashi Candlesticks, here it is one more powerful ally: Heikin Ashi Volume. This indicator is an exclusive idea and creation from us at Minions Labs for you.
Para aqueles que adoram operar usando os Candlesticks do tipo Heikin Ashi, aqui está mais um aliado poderoso: Heikin Ashi Volume. Este indicador é uma ideia e criação exclusiva nossa na Minions Labs para você.
Free!Heikin Ashi Volume DEMO
Free! -
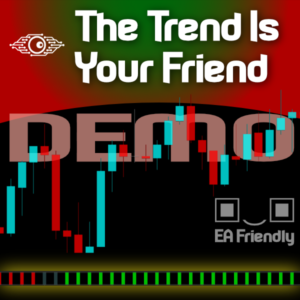
The Trend Is Your Friend! DEMO
Trading following the current trend is one of the most successful ways in terms of probability. The hard part of it is to recognize when the market is trending or not.
That’s the role of our indicator we called The Trend Is Your Friend Until It Is Not. Apart from its big name it is really easy to use and see when the market is trending or ranging. Through a little window of 3 colors you will identify if the
market is currently trending Up, Down, or ranging (sideways).Free! -
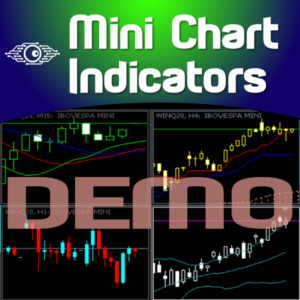
Mini Chart Indicators DEMO
We present the Mini Chart Indicators, a tool that you can drag and drop on your main chart and configure/add your own Indicators and Templates over any Mini Chart you have. This is a great idea for those using Strategy Analysis called “Triple Screen”
Free! -
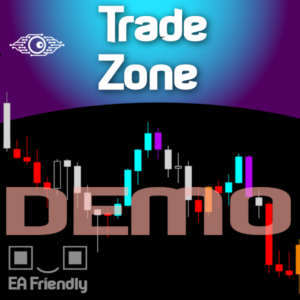
Bill WIlliam’s Trade Zone DEMO
For those who are fans of Bill William‘s strategy, here is the Trade Zone indicator filled with alerts and a better coloring system and EA ready (BUY & SELL buffers).
Free! -
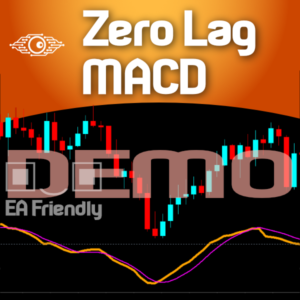
Zero Lag MACD DEMO
For those who are fans of the traditional MACD (Moving Average Convergence/Divergence) indicator, here it is a way faster indicator that could be very useful for intraday trading.
Free!Zero Lag MACD DEMO
Free! -
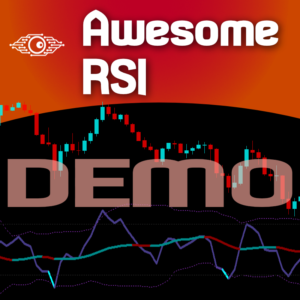
Awesome RSI DEMO
What if we take the RSI data and inject it into the Bollinger Bands, so we will get a graphical representation of the RSI data plotted as an indicator? Welcome to Minions Labs Awesome RSI indicator!
Free!Awesome RSI DEMO
Free! -
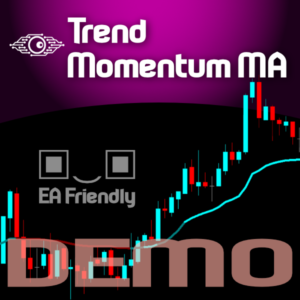
Trend Momentum MA DEMO
Imagine a simple and powerful line that gives you everything you need: Trend and Momentum. Welcome to the Trend Momentum Moving Average!
Free!Trend Momentum MA DEMO
Free! -
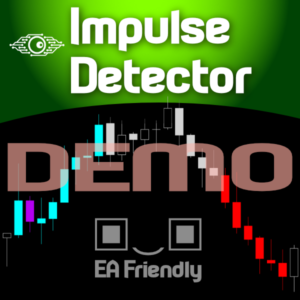
Impulse Detector DEMO
Imagine a support tool that Colors Up the candlesticks on your chart according to the market behavior, based on Trend, Momentum, Price Behavior, and/or Volume. You choose what to use!
Free!Impulse Detector DEMO
Free! -
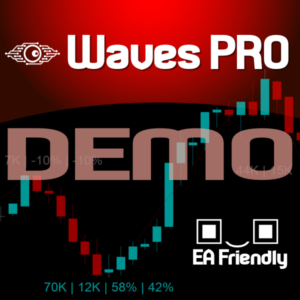
Waves PRO DEMO
For those who appreciate Richard Wyckoff approach for reading the markets, we at Minions Labs designed a tool derived – yes, derived, we put our own vision and sauce into this indicator – which we called Waves PRO.
Free!Waves PRO DEMO
Free! -
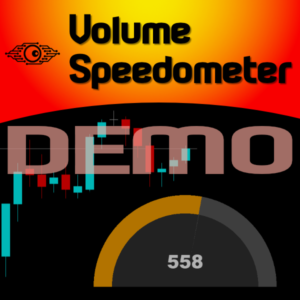
Volume Speedometer DEMO
Imagine the ability to have Volume Speed second by second presented to you in the form of a speedometer… Well, imagine no more… Welcome to the new Minions Labs creation: Volume Speedometer.
Free!Volume Speedometer DEMO
Free!


