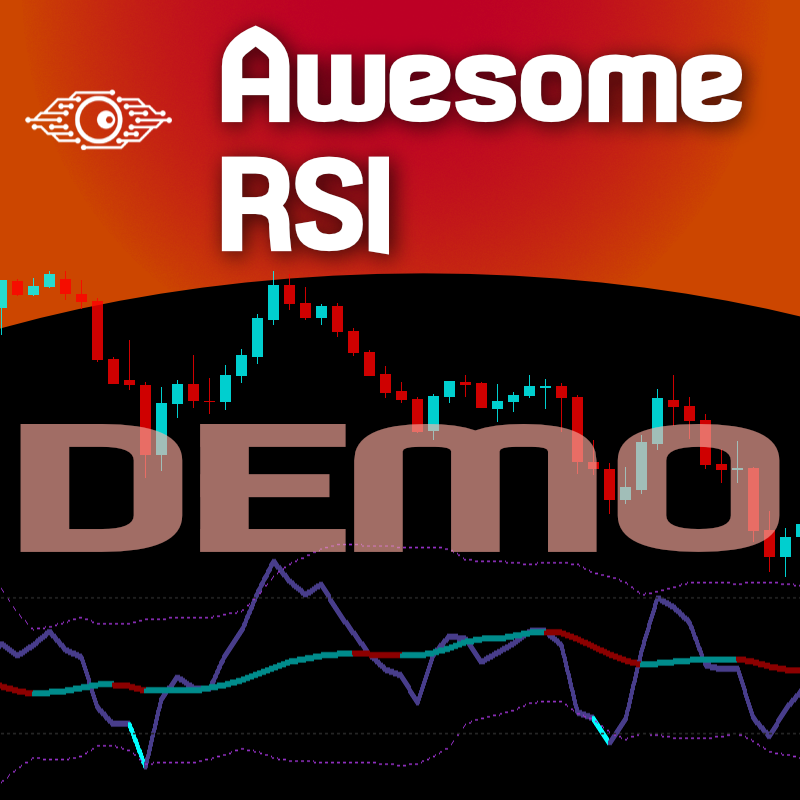
Awesome RSI DEMO
- Brand: Metatrader 5
Free!
In stock
What if we take the RSI data and inject it into the Bollinger Bands, so we will get a graphical representation of the RSI data plotted as an indicator? Welcome to Minions Labs Awesome RSI indicator!
The Relative Strenght Index presented to the world in 1978 by J. Welles Wilder Jr. in his book “New Concepts in Technical Trading Systems” is widely used around the world in several ways, not only with the traditional approach of Overbought and Oversold states, which in several cases and depending on the assets and timeframes it just simply doesn’t work anymore.
BUT, this indicator has its value when used, for instance, looking for divergences between its measuring system and the Prices appearing in your chart, among many others.
AND, because we at Minions Labs study a LOT, we found a very interesting symbiosis between RSI and Bollinger Bands, another indicator very well known by the traders around the world.
WHAT IF…
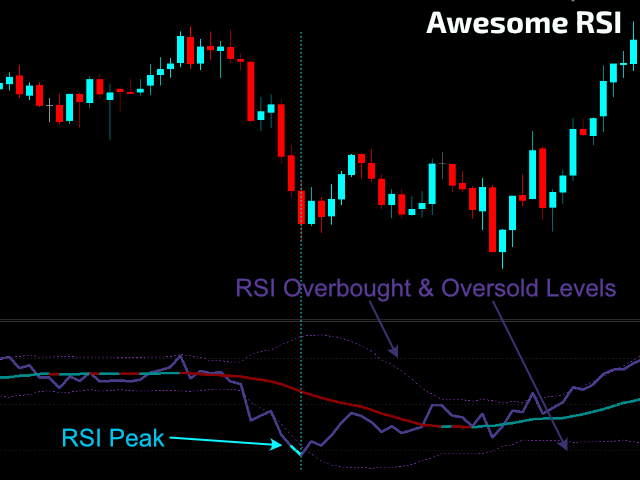
We take the RSI data and inject it into the Bollinger Bands, so we will get a graphical representation of the RSI data plotted as an indicator? So this way we can have a truly representation of probable Overbought and Oversold dynamic levels instead of the classical 70/30?
WELCOME TO THE AWESOME RSI!
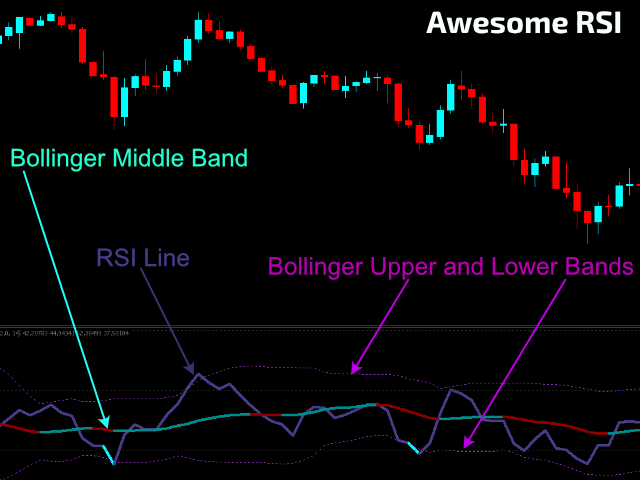
The Awesome RSI takes the RSI data values and uses them in the Bollinger Bands calculations, so the “Bands” represent the volatility of the RSI! With this approach, we can improve the measurements of peaks and the trend itself.
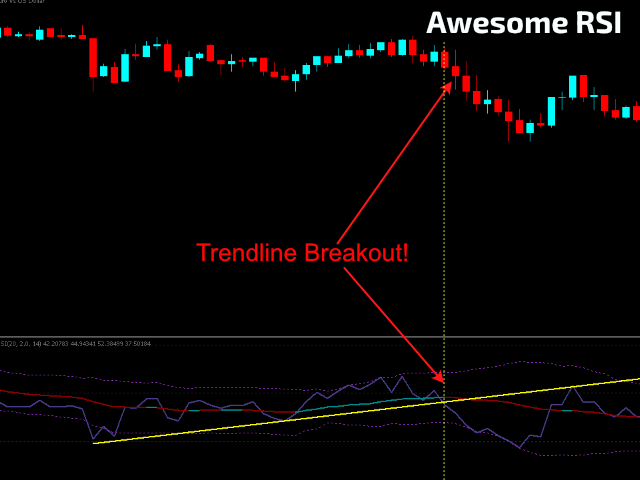
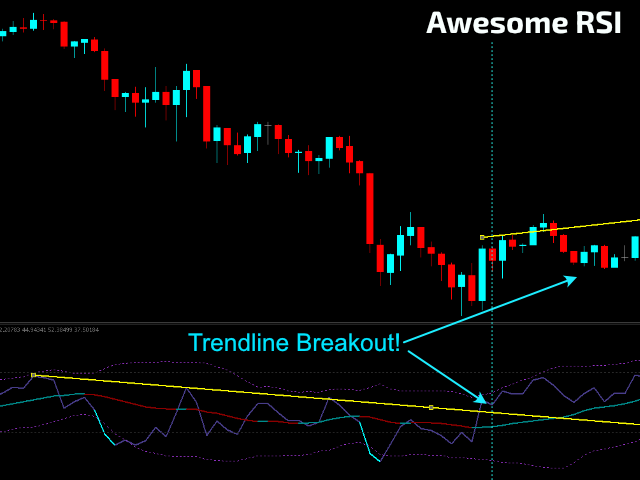
The indicator itself offers a myriad of readings as you can see for yourself in the video and on the screenshots below.
HOW TO “READ” THIS INDICATOR
- Now Overbought and Oversold levels can be read through the Upper and Lower bands of the Bollinger Bands. For easy reading, you can choose between 3 types of filtering: simple Bands crossing, Bands Crossing +
RSI above/below your desired Overbought and Oversold levels, and Bands crossing + RSI and Bands above/below your desired Overbought and Oversold levels. - You can draw manual trendlines over peaks and valleys on the indicator to monitor early breakouts of the current trend.
- You can also draw or visually spot divergencies between the peaks and valleys of the indicator and the Prices on your chart.
- You can monitor the Middle Band line crossing to early spot changes in the trend.
- Also, the Middle Band changes its color when the market is in an Uptrend or a Downtrend.
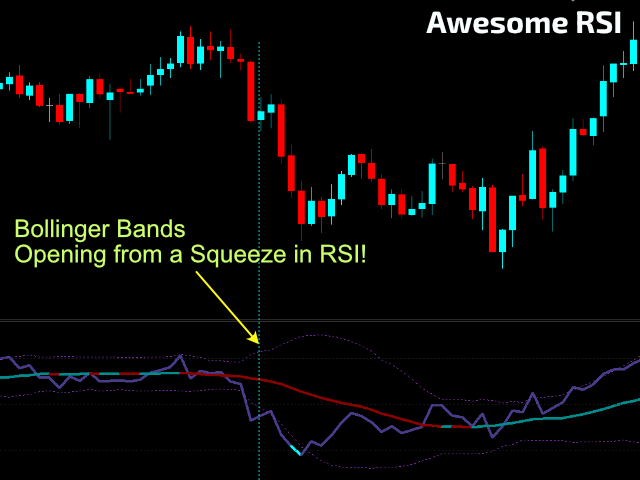
- You can see and detect RSI Squeezes.
- All of the readings above are possible if you CALIBRATE this indicator properly to your Trading Style / Asset / Timeframe.
SETTINGS
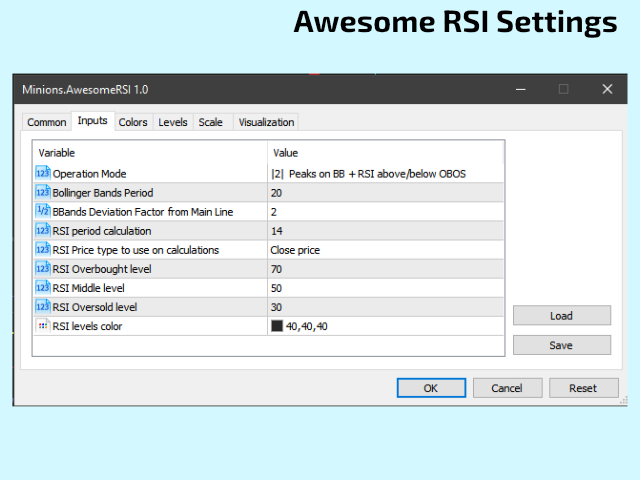
- Operation Mode (visual Markers):
- When RSI breaks the Upper and Lower Bollinger Bands.
- When RSI breaks the Upper and Lower Bollinger Bands, AND, RSI is above/below the Overbought and Oversold Levels.
- When RSI breaks the Upper and Lower Bollinger Bands, AND, RSI AND Upper/Lower Bands are above/below the Overbought and Oversold Levels.
- Bollinger Bands period
- Bollinger Bands Deviation Factor (from the Main Line)
- RSI period
- RSI Price Type to be used in calculations
- RSI Overbought level (classical=70)
- RSI Oversold level (classical=30)
- RSI Middle level (classical=50)
- Colors for the levels line in the indicator sub-window
- Alert System: You can choose alerts for RSI Overbought and Oversold
levels, sent directly your e-Mail, your Chart screen or by MT5 Mobile
app.
NOTE: This DEMO version will stop working after 15 minutes.
The FULL version is available here: Awesome RSI
Buffers to use on your EA:
- #0 – RSI data
- #1 – RSI Color: 0-RSI inside the Bands / 1-Outside the Upper Band / 2-Outside the Lower Band
- #2 – Bollinger Middle Band
- #3 – Bollinger Middle Band Color: 0-Uptrend / 1-Downtrend
- #4 – Upper Band data
- #5 – Lower Band Data
Didn’t Find a Feature You Need?
No product is perfect for everyone. If you think you need a missing feature from our product just send us a message. We love feedback!
Additional information
| Computer Type | 64-bits |
|---|---|
| Platform | Metatrader 5 |
Only logged in customers who have purchased this product may leave a review.
General Inquiries
There are no inquiries yet.






Reviews
There are no reviews yet.