

Bigger Than ATR DEMO
Free!
We at Minions Labs consider ATR (Average True Range) one of the most fantastic and most underrated indicators of Technical Analysis. Most of the traders really don’t give a sh* about the True Range of the market and this probably can be because they could not apply the data right away in a practical way over their charts or over their own strategy, leaving this indicator in the land of obscurity and doubt.
We at Minions Labs consider ATR (Average True Range) one of the most fantastic and most underrated indicators of Technical Analysis. Most of the traders really don’t give a sh* about the True Range of the market and this probably can be because they could not apply the data right away in a practical way over their charts or over their own strategy, leaving this indicator in the land of obscurity and doubt.
Well, this indicator, Bigger Than ATR, is a step forward to show you what is possible to do using the ATR data statistics…
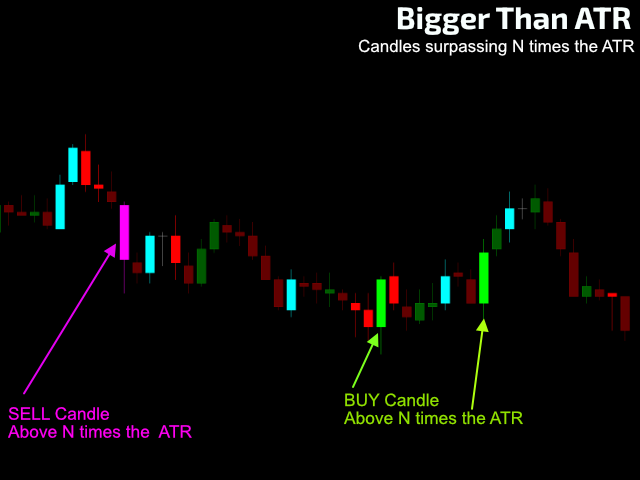
The idea behind this indicator is: Depending on the Timeframe you are using, when the market “invades” the current ATR measure it means that it is expanding and getting traction. In which direction? Well, ATR doesn’t tell you that, but this indicator will try to answer that question, using the current candle Highs/Lows information and its Volume, so you can take the decision of entering a trade if it is a good opportunity based on your readings and your strategies…
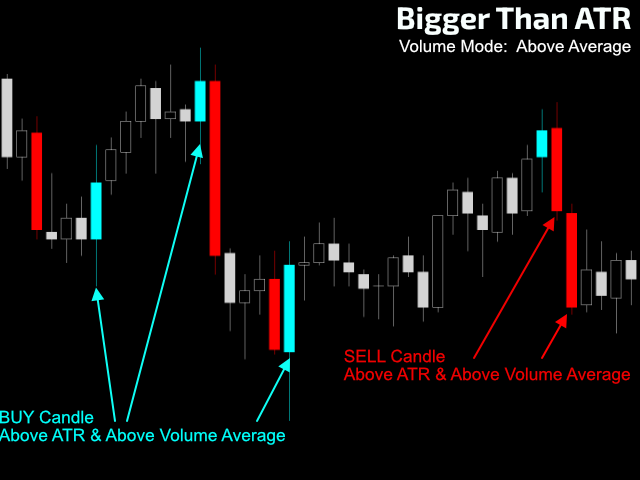
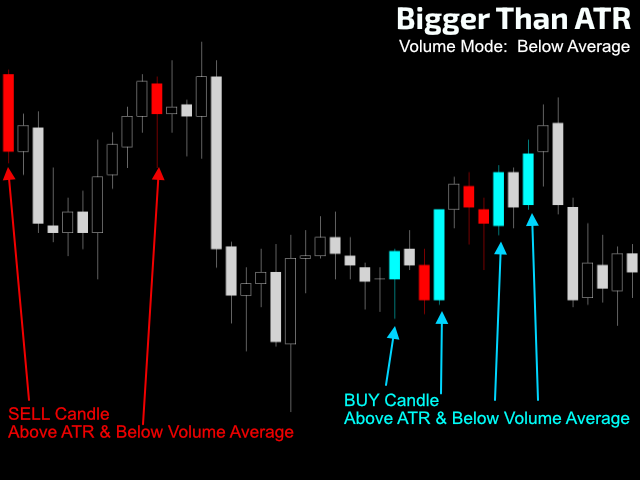
Bigger Than ATR uses the Candlestick Chart to color up those candles that became bigger than the current ATR reading, with 2 additional VOLUME analysis options (Yes! Volume!):
- Candles Bigger than ATR with high (above average) Volume.
- Candles Bigger than ATR with low (below average) Volume.
HOW TO “READ” THIS INDICATOR
- You can use this indicator in any timeframe and create your own analysis of the current asset. The colored candles will give you clues of market behavior when the limit ATR is being reached/tested.
- Depending on the Volume analysis option you choose you can create trend following trades or counter-trend ones, i.e. for Scalping…
- Use your imagination and intuition to test in live markets to “see” the opportunities on your preferred asset and timeframe.
- Please note that when using Volume Mode “Above the average”, the indicator DOES NOT repaint!. But, when using the Volume Mode “Below the average”, and for obvious reasons, the indicator WILL repaint when the candle gains traction and surpasses the average Volume.
- If you turn ON the “Draw markers on Chart (realtime threshold breakout)?“
feature – only works for realtime analysis or during Visual Backtest –
the indicator will draw a small symbol on the exact Price that broke the
ATR threshold.
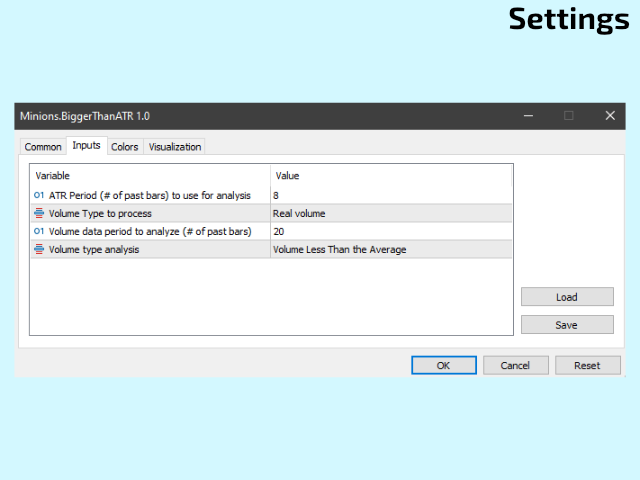
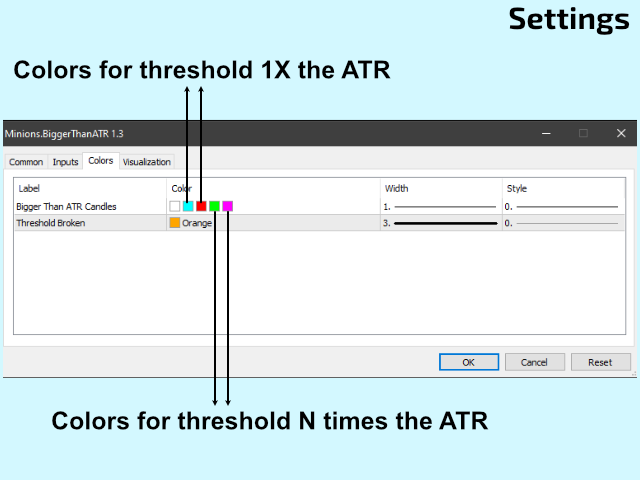
SETTINGS
- ATR Period (# of past bars) to use for analysis
- Volume Type to process (REAL Volume or TICKS Volume)
- Volume data period to analyze (# of past bars)
- Volume type analysis: Volume Higher than the Average / Volume Lower than the Average
- Draw markers on Chart (realtime threshold breakout)?
- Marker Symbol number (for more symbols please visit: www.mql5.com/en/docs/constants/objectconstants/wingdings)
BUFFERS TO USE ON YOUR EA
#4 – Color buffer. Possible Values:
0 = Below ATR, nothing to light up.
1 = BUY Candle
2 = SELL Candle
| After experimenting with this DEMO version, you can find the FULL VERSION here: Bigger Than ATR indicator… |
|---|
Didn’t Find a Feature You Need?
No product is perfect for everyone. If you think you need a missing feature from our product just send us a message. We love feedback!
Additional information
| Computer Type | 64-bits |
|---|---|
| Platform | Metatrader 5 |
General Inquiries
There are no inquiries yet.
Reviews
There are no reviews yet.